This doesn't look good.
This is basically like being the phrenologist-in-chief or the senior palm reader. And Elliott Wave theory is hilarious. Burton Malkiel gave a bunch of Elliot technicians a "stock curve" generated by flipping a coin. They all predicted that the stock would immediately gain, except for the 20% who predicted it would immediately crash.Murray Gunn, the head of technical analysis
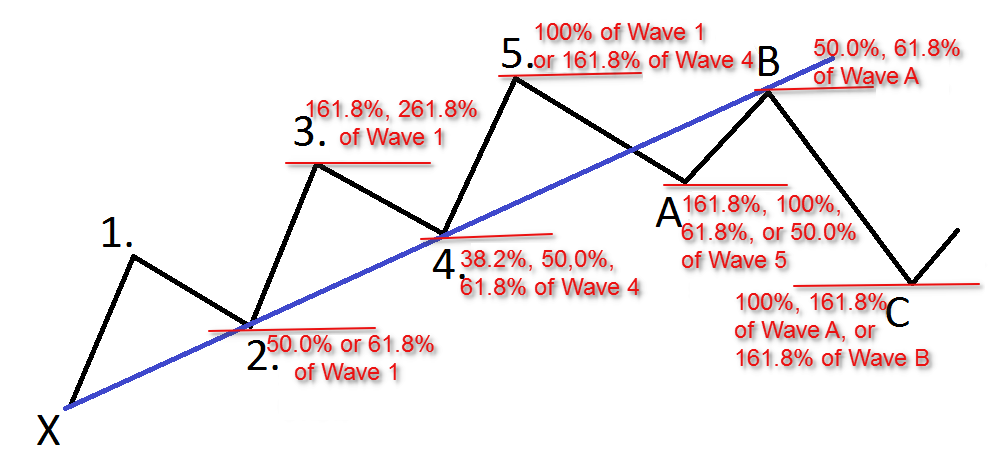
Gunn uses a type of technical analysis called the Elliott Wave Principle, which tracks alternating patterns in the stock market to discern investors' behavior and possible next moves
Dude that ain't gullibility. Technical analysis is this whole thing in the stock market. All the pro software lets you throw like a million different tech analysis curves on shit. There are tens of thousands of people who would be deeply offended by my derogatory statements towards their financial religion. I think it comes from business majors that barely take algebra being intimidated by quants that write theories. So you end up convincing yourself that this shit is science. And when there's an entire industry training you and convincing you that it is, accepting that the "experts" actually know something is a natural response.
I would have thought predictions of market fluctuations without the use of differential equations or other concrete mathematical definitions would be laughed at, in 2016. Wikipedia: Cannot believe that the head of HSBC would pay heed to this technique. C'mon, you saw the potato I posted, you really think it was coincidence that thing looked a dude, man?Elliott wave analysts (or Elliotticians) hold that each individual wave has its own signature or characteristic, which typically reflects the psychology of the moment.[2][3] Understanding those personalities is key to the application of the Wave Principle; they are defined below. (Definitions assume a bull market in equities; the characteristics apply in reverse in bear markets.)
Critics say it is a form of pareidolia.
There are certainly plenty who try using real math, but they run into the limitations that always appear with real math and data: A) Historical data assumes no structural shift (legislation, etc.) outside of the historic range. B) Most tradable things are highly correlated, which has to be accounted for: two similar stock charts are not two independent datasets. Once the correlation is accounted for, even using all global markets gives a fairly small start for large macro forecasts. And people usually prefer an exciting, bold, precise prediction with no grounds at all over a careful mathematical prediction with a full explanation of expedited ranges, significance, and assumptions.I would have thought predictions of market fluctuations without the use of differential equations or other concrete mathematical definitions would be laughed at, in 2016.
All the best equations involve exactly zero people. Well, my favorites, at least.
